|
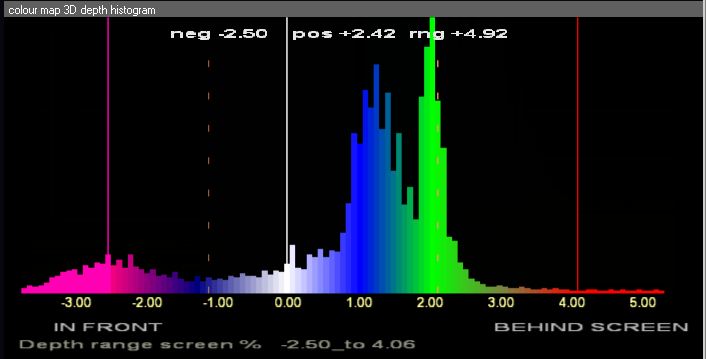
The depth histogram actually shows the full range of values being
used in your shots. This can use the same colour scale as the depth
map. A numerical scale shows exactly what values you are hitting. In
the control menu the scale can be selected to be in pixels or
percentage of screen width.
With the histogram on-screen it is simple to adjust the inter-ocular
distance between the cameras on the rig or their convergence or
optimise the depth budget in use. The noise 'floor' of the histogram
is an early warning of other problems like camera tilt. Adjust for
minimum floor and use some of the other Cel-Scope3D tools optimum
settings.
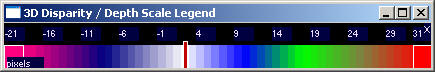
The false colour scheme serves to pinpoint the areas of interest.
The same colours are used in the depth map display. This mode show
th screen plane as white. You can select from alternative colour
maps according to preference including one map similar to the Sony
'box' with a green zero depth.
|
|
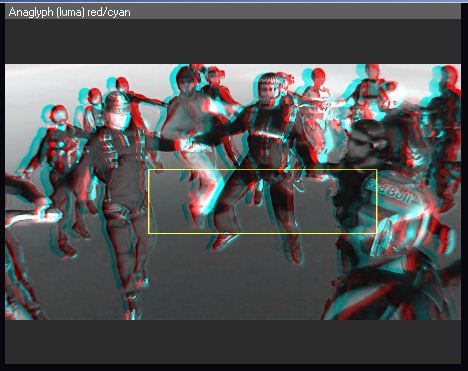
The depth map shows
which scene objects are where in the apparent depth. The images from
both left and right are compared on a pixel by pixel basis. The
horizontal disparity, the apparent shift between each element in the
image is translated into a depth value and painted according to a
precise scale. The aids rapid identification of any problem objects
too far forward or back. You can also see if the depth budget is
being full used; if not your 3D could be looking too flat. The depth
map is normally shown in outline as in 3D it the position of edges
that is important. But there are menu options to show solid too and
vary the display parameters for advanced users.
This is what takes
enormous amounts of calculation by the software to do. With a Fermi
based NVidia graphics card in the PC, real time update can be
achieved subject to picture format size and budget range.
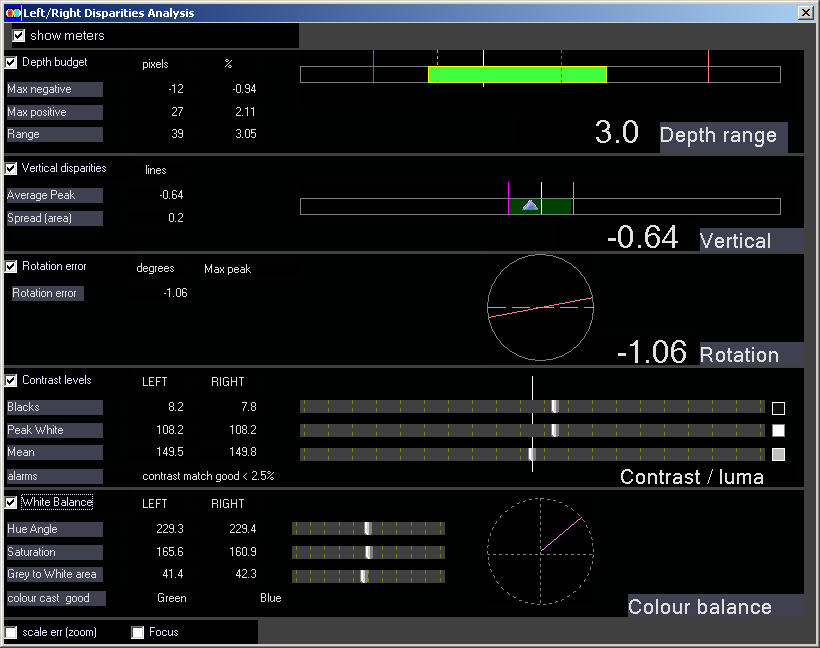
The depth analysis readout simply summarises all that data with your
max and min values and the overall average. You can also set up and
alarm for any out of budget excursion so you can get on without
having to continually look at the displays.
 |
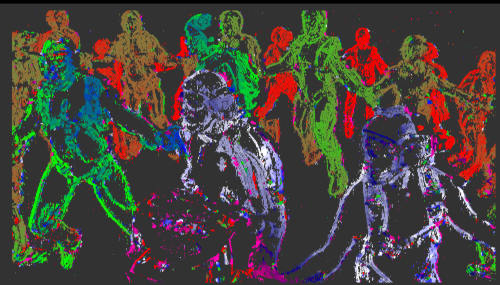
If the mouse cursor is placed in the depth map, a
yellow marker in the histogram shows exactly where that point is in
depth. With a touch screen plugged-in: just touch the point of
interest...
 |